
Quick Analysis takes a range of data and helps you pick the perfect chart with just a few commands.
- Select a range of cells.
Select the Quick Analysis button that appears at the bottom right corner of the selected data.
Or, press Ctrl + Q.
Select Charts.
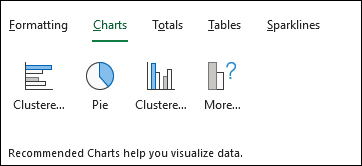
- Hover over the chart types to preview a chart, and then select the chart you want.
- Select More > All Charts to all available see all charts available. Preview and select OK when done to insert the chart.

Comments
0 comments
Please sign in to leave a comment.